Showing posts with label reverse engineering. Show all posts

Tuesday, April 29, 2014

PowerShell Summit 2014

Yesterday, I gave two presentations at the PowerShell Summit. The first presentation was on advanced eventing techniques in PowerShell and the second was on using PowerShell as a reverse engineering tool. As it turns out, PowerShell is an awesome tool for automating the analysis of .NET malware samples. I’ve included the slides for each talk. Additionally, you can download all of my demo code here. Just be mindful that this is all PoC code so it’s not in a well-polished state. Note: I provided the MD5 hashes of the malware samples but I won’t be providing a direct download link for them. Enjoy!

As a security professional, attending the PowerShell Summit is a great opportunity for me to meet and mingle with those outside of the security field as it forces me to get out of my security bubble and gain a completely different perspective from a wide range of IT pros and developers who are using PowerShell for completely non-malicious purposes ;)! Not to mention, getting to pick the brains of Microsoft employees like Jeffrey Snover, Lee Holmes, Jason Shirk, and Joe Bialek is humbling to say the least.


Saturday, November 16, 2013

Reverse Engineering InternalCall Methods in .NET

Often times, when attempting to reverse engineer a particular .NET method, I will hit a wall because I’ll dig in far enough into the method’s implementation that I’ll reach a private method marked [MethodImpl(MethodImplOptions.InternalCall)]. For example, I was interested in seeing how the .NET framework loads PE files in memory via a byte array using the System.Reflection.Assembly.Load(Byte[]) method. When viewed in ILSpy (my favorite .NET decompiler), it will show the following implementation:
 
 
So the first thing it does is check to see if you’re allowed to load a PE image in the first place via the CheckLoadByteArraySupported method. Basically, if the executing assembly is a tile app, then you will not be allowed to load a PE file as a byte array. It then calls the RuntimeAssembly.nLoadImage method. If you click on this method in ILSpy, you will be disappointed to find that there does not appear to be a managed implementation.
 
 
As you can see, all you get is a method signature and an InternalCall property. To begin to understand how we might be able reverse engineer this method, we need to know the definition of InternalCall. According to MSDN documentation, InternalCall refers to a method call that “is internal, that is, it calls a method that is implemented within the common language runtime.” So it would seem likely that this method is implemented as a native function in clr.dll. To validate my assumption, let’s use Windbg with sos.dll – the managed code debugger extension. My goal using Windbg will be to determine the native pointer for the nLoadImage method and see if it jumps to its respective native function in clr.dll. I will attach Windbg to PowerShell since PowerShell will make it easy to get the information needed by the SOS debugger extension. The first thing I need to do is get the metadata token for the nLoadImage method. This will be used in Windbg to resolve the method.
 
 
As you can see, the Get-ILDisassembly function in PowerSploit conveniently provides the metadata token for the nLoadImage method. Now on to Windbg for further analysis…
 
 
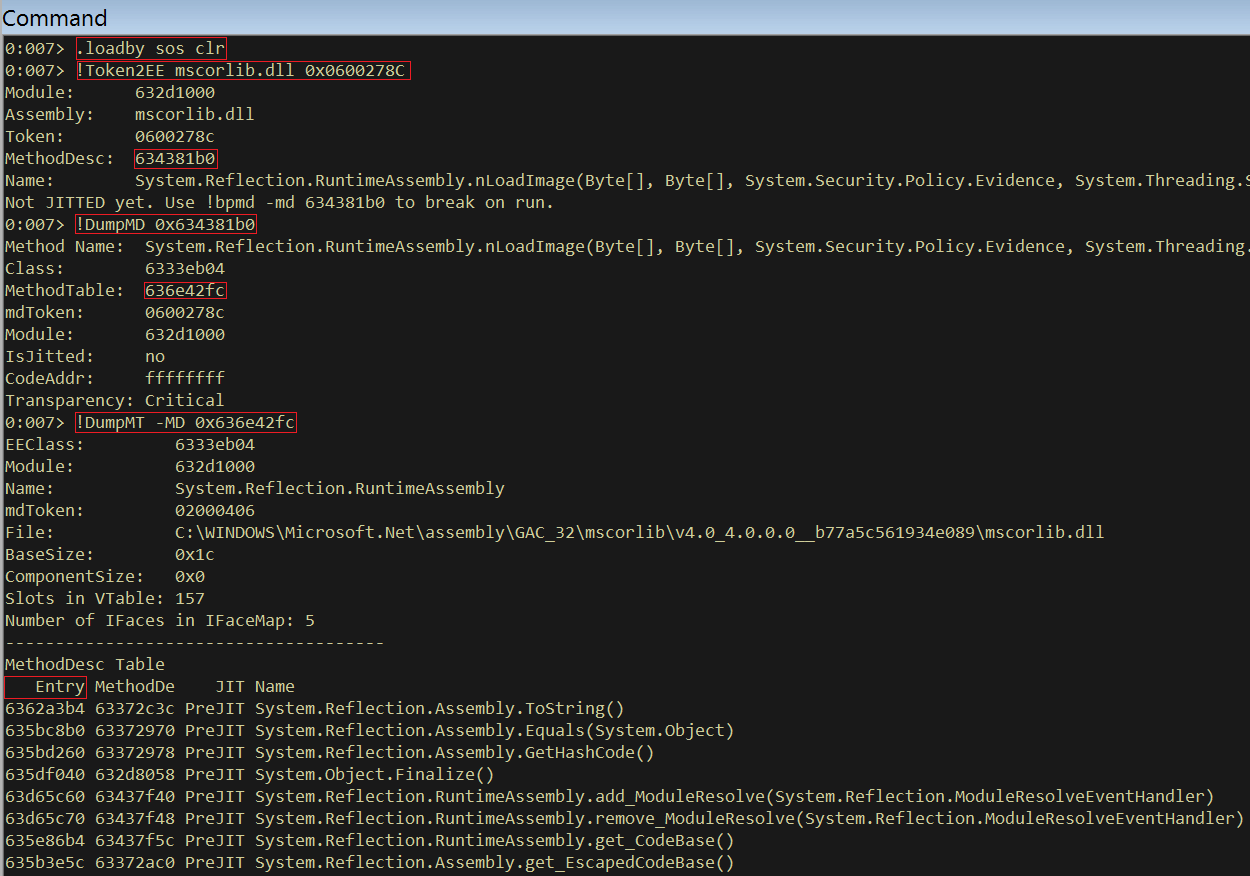
The following commands were executed:
 
1) .loadby sos clr
 
Load the SOS debugging extension from the directory that clr.dll is loaded from
 
2) !Token2EE mscorlib.dll 0x0600278C
 
Retrieves the MethodDesc of the nLoadImage method. The first argument (mscorlib.dll) is the module that implements the nLoadImage method and the hex number is the metadata token retrieved from PowerShell.
 
3) !DumpMD 0x634381b0
 
I then dump information about the MethodDesc. This will give the address of the method table for the object that implements nLoadImage
 
4) !DumpMT -MD 0x636e42fc
 
This will dump all of the methods for the System.Reflection.RuntimeAssembly class with their respective native entry point. nLoadImage has the following entry:
 
635910a0 634381b0   NONE System.Reflection.RuntimeAssembly.nLoadImage(Byte[], Byte[], System.Security.Policy.Evidence, System.Threading.StackCrawlMark ByRef, Boolean, System.Security.SecurityContextSource)
 
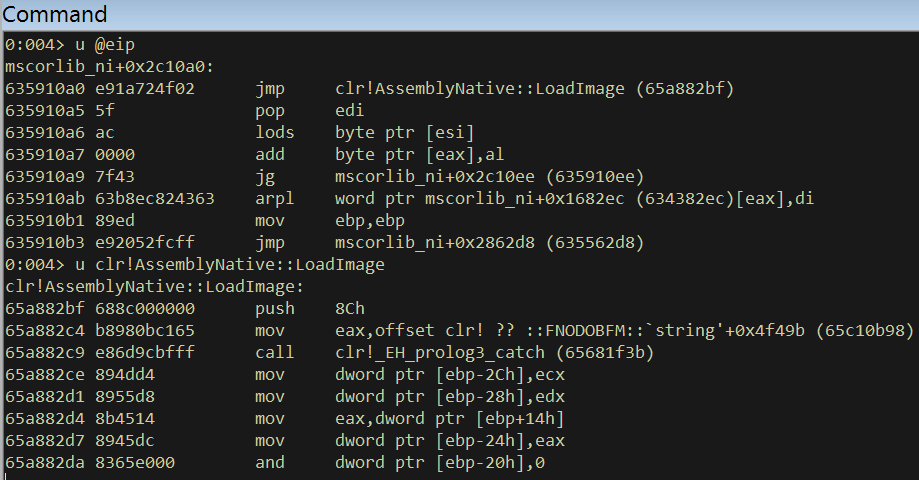
So the native address for nLoadImage is 0x635910a0. Now, set a breakpoint on that address, let the program continue execution and use PowerShell to call the Load method on a bogus PE byte array.
 
PS C:\> [Reflection.Assembly]::Load(([Byte[]]@(1,2,3)))
 
You’ll then hit your breakpoint in WIndbg and if you disassemble from where you landed, the function that implements the nLoadImage method will be crystal clear – clr!AssemblyNative::LoadImage
 
 
You can now use IDA for further analysis and begin digging into the actual implementation of this InternalCall method!
 
 
After digging into some of the InternalCall methods in IDA you’ll quickly see that most functions use the fastcall convention. In x86, this means that a static function will pass its first two arguments via ECX and EDX. If it’s an instance function, the ‘this’ pointer will be passed via ECX (as is standard in thiscall) and its first argument via EDX. Any remaining arguments are pushed onto the stack.
 
So for the handful of people that have wondered where the implementation for an InternalCall method lies, I hope this post has been helpful.

Saturday, November 17, 2012

Get-MethodAddress - A Tool For Comparing .NET MSIL and ASM Method Implementations

Download: Get-MethodAddress

Lately, as part of my research, I've found myself wanting to learn more about how MSIL (Microsoft Intermediate Language) opcodes in .NET assemblies get translated to assembly language instructions. Unfortunately, there was no easy way that I was aware of to get the unmanaged address of a .NET method. After digging in to the wealth of MSIL opcodes at my disposal, I learned that the Ldftn opcode would suit my needs. This find resulted the Get-MethodAddress PowerShell cmdlet. Get-MethodAddress uses reflection to build an assembly on the fly and assemble a method using the opcodes of my choosing - specifically, Ldftn. Here is the code:
The relevant lines in the code are the ones that specify the MSIL opcodes to be assembled:

$Generator.Emit([System.Reflection.Emit.OpCodes]::Ldftn, $MethodInfo)
$Generator.Emit([System.Reflection.Emit.OpCodes]::Conv_Ovf_U8)
$Generator.Emit([System.Reflection.Emit.OpCodes]::Ret)


Ldftn as described by Microsoft "pushes an unmanaged pointer (type native int) to the native code implementing a specific method onto the evaluation stack." I then convert the native int to an unsigned int64 using the Conv_Ovf_U8 opcode and then return the value to the caller with Ret.

So how might one use this cmdlet? As an example, say I'm interested in the IL and ASM implementation of the [System.Intptr].ToPointer method. To get the IL of this method, you could use your .NET disassembler of choice. I like PowerShell so let's use that:

PS> ([IntPtr].GetMethod('ToPointer').GetMethodBody().GetILAsByteArray() | % {"0x$($_.ToString('X2'))"}) -join ','
0x02,0x7B,0x53,0x04,0x00,0x04,0x2A

The IL opcodes above translate into the following disassembly:

0x02                     ldarg.0
0x7B,0x53,0x04,0x00,0x04 ldfld void* System.IntPtr::m_value
0x2A                     ret

The code above simply loads a reference to an instance of an IntPtr object, dereferences the value held in the m_value field and returns the result. I suspect that the JITed representation would be equally straightforward. Let's confirm that:

PS> Get-MethodAddress ([IntPtr].GetMethod('ToPointer'))
0x000007FF35544CC0

Viewing the assembly instructions in WinDbg yielded the following:

mscorlib_ni+0xd04cc0:
000007ff`35544cc0 488b01    mov     rax,qword ptr [rcx]
000007ff`35544cc3 c3        ret
000007ff`35544cc4 cc        int     3


The assembly above does exactly what I expected. When ToPointer gets executed, the m_value field of the IntPtr instance gets loaded into the rcx register and dereferenced. Moving this value into rax followed by a ret implies that the dereferenced value is the return value of the ToPointer method.

It's worth noting the module name in the WinDbg output - mscorlib_ni. NI stands for "native image" which means that the version of mscorlib that was loaded into the PowerShell process was the version whose IL was converted to assembly language ahead of time.

Lastly, bear in mind that the combination of opcodes I used in the cmdlet are unverifiable which basically means that this technique cannot be used in more restricted .NET implementation (i.e. Silverlight, Windows Runtime, etc.). For a reference of IL opcodes and IL verification, read ECMA-335 CLI Partition III - CIL.


Tuesday, June 26, 2012

Get-ILDisassembly - A Scriptable MSIL Disassembler Added to PowerSploit


PowerSploit Repo

I just added Get-ILDisassembly to the PowerSploit project. This tool takes any MethodInfo object and returns the disassembly for that method, assuming it's not a native method or implemented via P/Invoke.

Get-ILDisassembly relies upon the fact that you can dump a raw byte array of a method's IL using the GetILAsByteArray method of the System.Reflection.MethodBody class.

MSIL is surprising easy to disassemble. It consists of either one or two-byte opcodes followed by an operand in many cases. Operands typically consist of one of three options:

1) An immediate value
2) A 32-bit metadata token which is used to describe a member of an object. The metadata token is then resolved with the ResolveMember or ResolveString methods in the System.Reflection.Module class.
3) A location to branch to in conditional logic

Each MSIL opcode is also described in detail in the System.Reflection.Emit.OpCodes class. Unfortunately, there is no direct way to resolve an opcode from a raw byte. In my function, I simply generate a hashtable that links a byte value to its respective MSIL opcode.

Here are some examples of how you could use Get-ILDisassembly:
In the example above, I'm simply dumping the disassembly of the System.Int32.Parse(String) method.
In this example, I disassemble the System.Array.BinarySearch(Array, Object) method.

Lastly, as I hinted upon on Twitter, you could certainly get creative with Get-ILDisassembly. I used it to calculate the frequency of all opcodes in every exported member of every loaded module in PowerShell using the following commands (caution: this takes a long time to run):
The result of this command will resemble the following:


Lastly, I would be a charlatan without mentioning that the disassembly techniques I used came straight out of the book "C# 4.0 in a Nutshell" and was used with generous permission from O'Reilly Media and the authors, Joseph Albahari and Ben Albahari. Enjoy!

Thursday, July 7, 2011

Post-mortem Analysis of a Use-After-Free Vulnerability (CVE-2011-1260)

Recently, I've been looking into the exploitation of use-after-free vulnerabilities. This class of bug is very application specific, but armed with just the right amount of knowledge these vulnerabilities can be exploited to bypass most modern OS exploit mitigations. After reading Nephi Johnson's (@d0c_s4vage) excellent article[1] on exploiting an IE use-after-free vulnerability, I decided to ride his coattails and show the steps I used to analyze his proof-of-concept crash code.

As shown in his blog post, here is Nephi's test case that crashes IE:
Internet Explorer crashes at mshtml!CElement::Doc+0x2

76c.640): Access violation - code c0000005 (first chance)
First chance exceptions are reported before any exception handling.
This exception may be expected and handled.
eax=00000000 ebx=004aedc0 ecx=004e00e9 edx=00000000 esi=0209e138 edi=00000000
eip=6d55c402 esp=0209e10c ebp=0209e124 iopl=0         nv up ei pl zr na pe nc
cs=001b  ss=0023  ds=0023  es=0023  fs=003b  gs=0000             efl=00010246
mshtml!CElement::Doc+0x2:
6d55c402 8b5070          mov     edx,dword ptr [eax+70h] ds:0023:00000070=????????

Here is the order of execution leading to the crash:

mshtml!CTreeNode::ComputeFormats+0x42
6d58595a 8b0b            mov     ecx,dword ptr [ebx]
6d58595c e89f6afdff      call    mshtml!CElement::Doc (6d55c400)
mshtml!CElement::Doc:
6d55c400 8b01            mov     eax,dword ptr [ecx]
6d55c402 8b5070          mov     edx,dword ptr [eax+70h] ds:0023:00000070=????????
6d55c405 ffd2            call    edx

This is a classic C++ use-after-free vulnerability. IE is trying to call a function within a previously freed object's virtual function table. In the disassembly above, a pointer to some object [EBX] has a pointer to its virtual function table [ECX] that subsequently calls a function at offset 0x70 in its vftable [EAX+0x70].

What we need to find out is what type of object was freed and how many bytes get allocated for that object. That way, we can craft fake objects of that size (using javascript) whose vftable at offset 0x70 point to our shellcode.

Since mshtml!CTreeNode::ComputeFormats+0x42 points to the object in question (in EBX), I set a breakpoint in Windbg on that instruction and got the following:
As can be seen above, EBX points to a freed CObjectElement object. How can we know for sure that the object was freed and that it points to a CObjectElement object? Enabling the page heap and user stack traces of every call to malloc and free will do the trick. This technique also allows us to observe the size allocated to CObjectElement.
The size that gets allocated to the CObjectElement object is 0xE0. It is also handy to see the call stacks of what allocated and freed the object. The size allocated for the object was determined via dynamic analysis. There's more than one way to skin a cat though. The same information can be gleaned via static analysis. A brief glance of the mshtml!CObjectElement::CreateElement function (which was called in the call stack above) in IDA shows that 0xE0 bytes is allocated for CObjectElement.


According to the disassembly (for CObjectElement::CObjectElement), the actual size of the class is 0xDC. However, 0xE0 is allocated on the heap because the compiler rounded up the size to the nearest DWORD boundary.


Lastly, although it is not always necessary for exploitation, let's determine the actual function that should have been called at the time of the crash. This can be accomplished several ways in Windbg.
The function that should have been called was mshtml!CElement::SecurityContext.

So to refresh our memories, what was needed to begin exploiting a use-after-free bug?

1) The type of object referenced after being freed
2) The size allocated to the object

There is no magic command that will give you this information and as usual, there is always more than one way to obtain this information. The key is to understand what lead to the crash. The next step is to utilize javascript to declare string variables that will allocate fake objects in the heap that point to attacker controlled shellcode (via heap spraying). This can be accomplished reliably without needing to point to a typical address like 0x0C0C0C0C which serves as both an address in the heap and a NOP slide. More on that in a future blog post...

References:

1. N. Johnson, "Insecticides don't kill bugs, Patch Tuesdays do,"
June 16, 2011, http://d0cs4vage.blogspot.com/2011/06/insecticides-dont-kill-bugs-patch.html